Multi-Strike OI Analysis
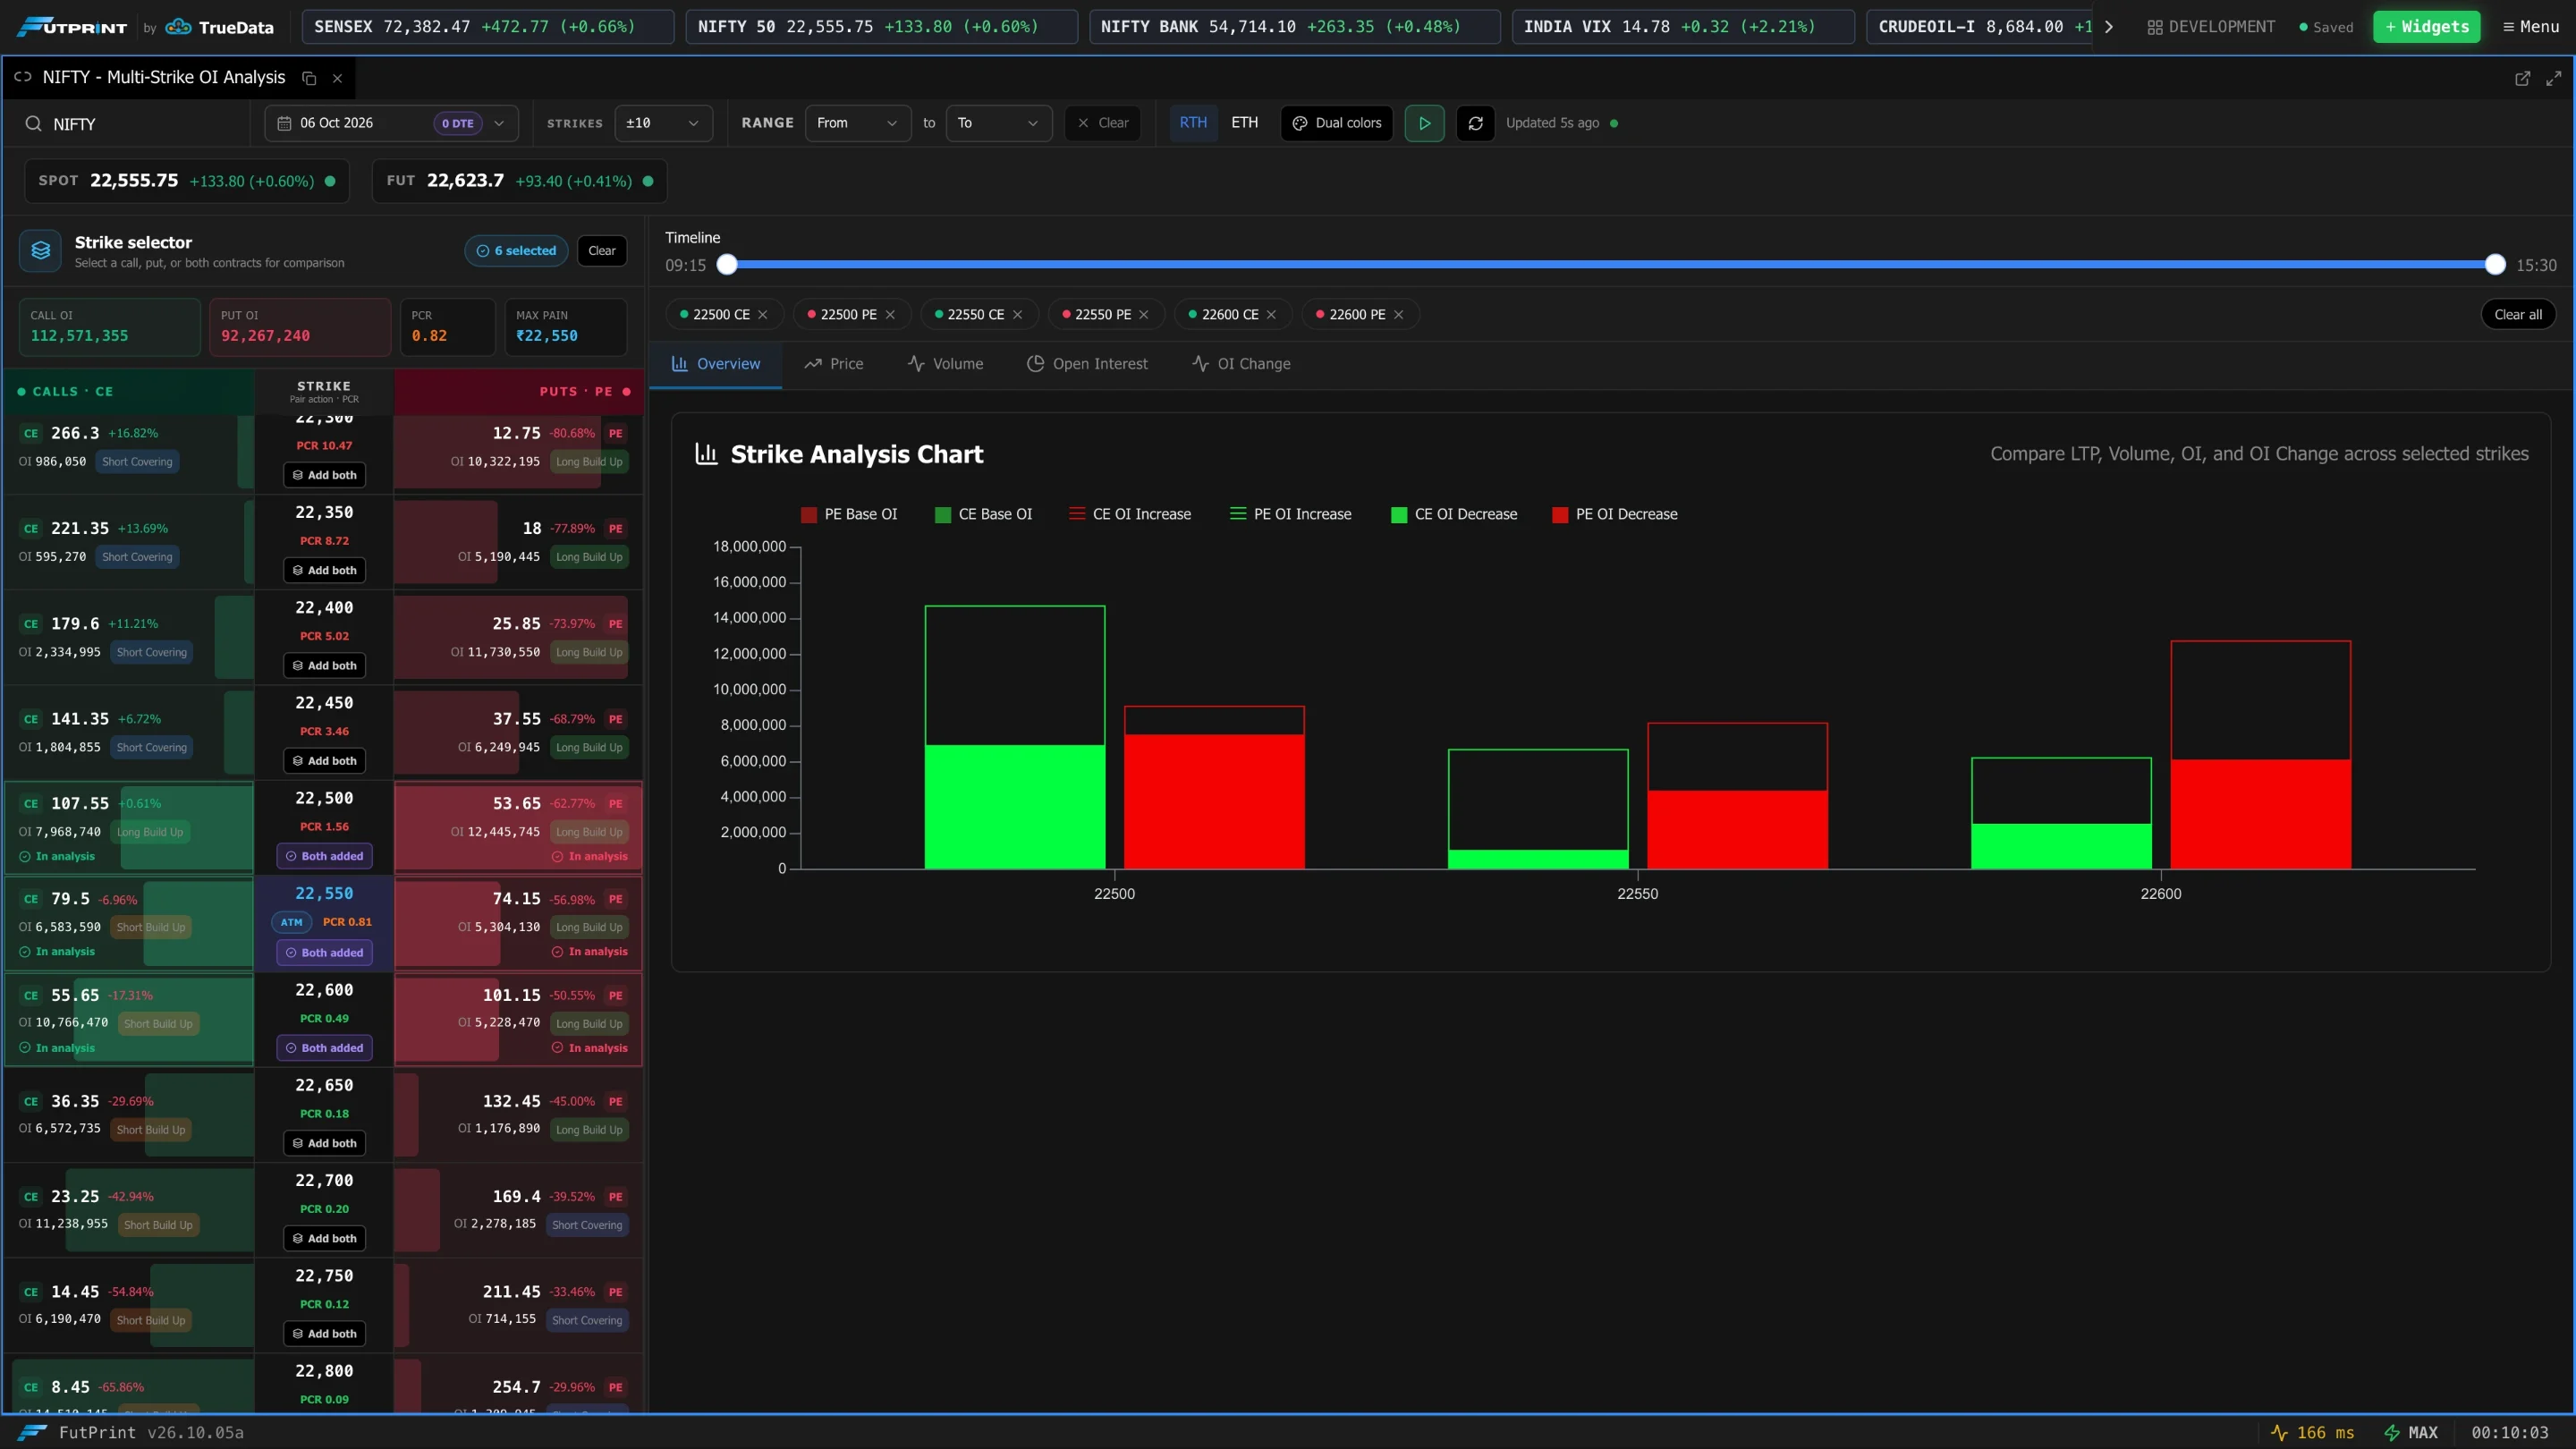
Multi-Strike OI Analysis compares several option strikes over the session on one chart: their price, volume, open interest and change in OI. Use it to see which strikes are being built up or unwound, and when.
Getting started
- 1Search a symbol
Search and select the underlying. Until then the panel shows Search and select a symbol to start analyzing option strikes.
- 2Choose the expiry and strike window
Pick the expiry and how many strikes around ATM to list (for example ±10).
- 3Add strikes
In the Strike selector, add a call, a put, or use Add both on a strike. Each selection appears as a chip above the chart; click its × to remove it, or use Clear all.
The toolbar
| Control | What it does |
|---|---|
| Symbol search, expiry, Strikes | What is loaded into the strike selector. |
| Range — From / To | Restrict the charts to part of the session. Clear removes the range. |
| RTH / ETH | Regular trading hours (9:15–15:30 IST) or the extended session including the evening. |
| Dual colors | Colours each call/put pair of a strike consistently. |
| Auto-refresh | Refreshes the data every 60 seconds while on. |
| Force refresh data | Reload immediately. The last refresh time is shown beside it. |
The Spot and Fut prices sit under the toolbar.
The strike selector
The header shows total Call OI, Put OI, the PCR (put OI divided by call OI) and Max pain for the expiry. Each row is one strike with, for the call and the put: the last price and its change, open interest, and a buildup tag such as Long Build Up or Short Covering. The strike's own PCR is shown in the centre, and the at-the-money strike is marked ATM.
Drag the divider to resize the selector; double-click it to reset.
The timeline
The Timeline slider above the chart scrubs through the session. Reset to full session returns to the whole day.
The chart tabs
| Tab | Shows |
|---|---|
| Overview | A bar chart per selected strike: base OI and the increase or decrease for the call and put. |
| Price | Each selected contract's price through the session. |
| Volume | Traded volume per interval for each contract. |
| Open Interest | Each contract's open interest through the session. |
| OI Change | The change in open interest since the session start. |
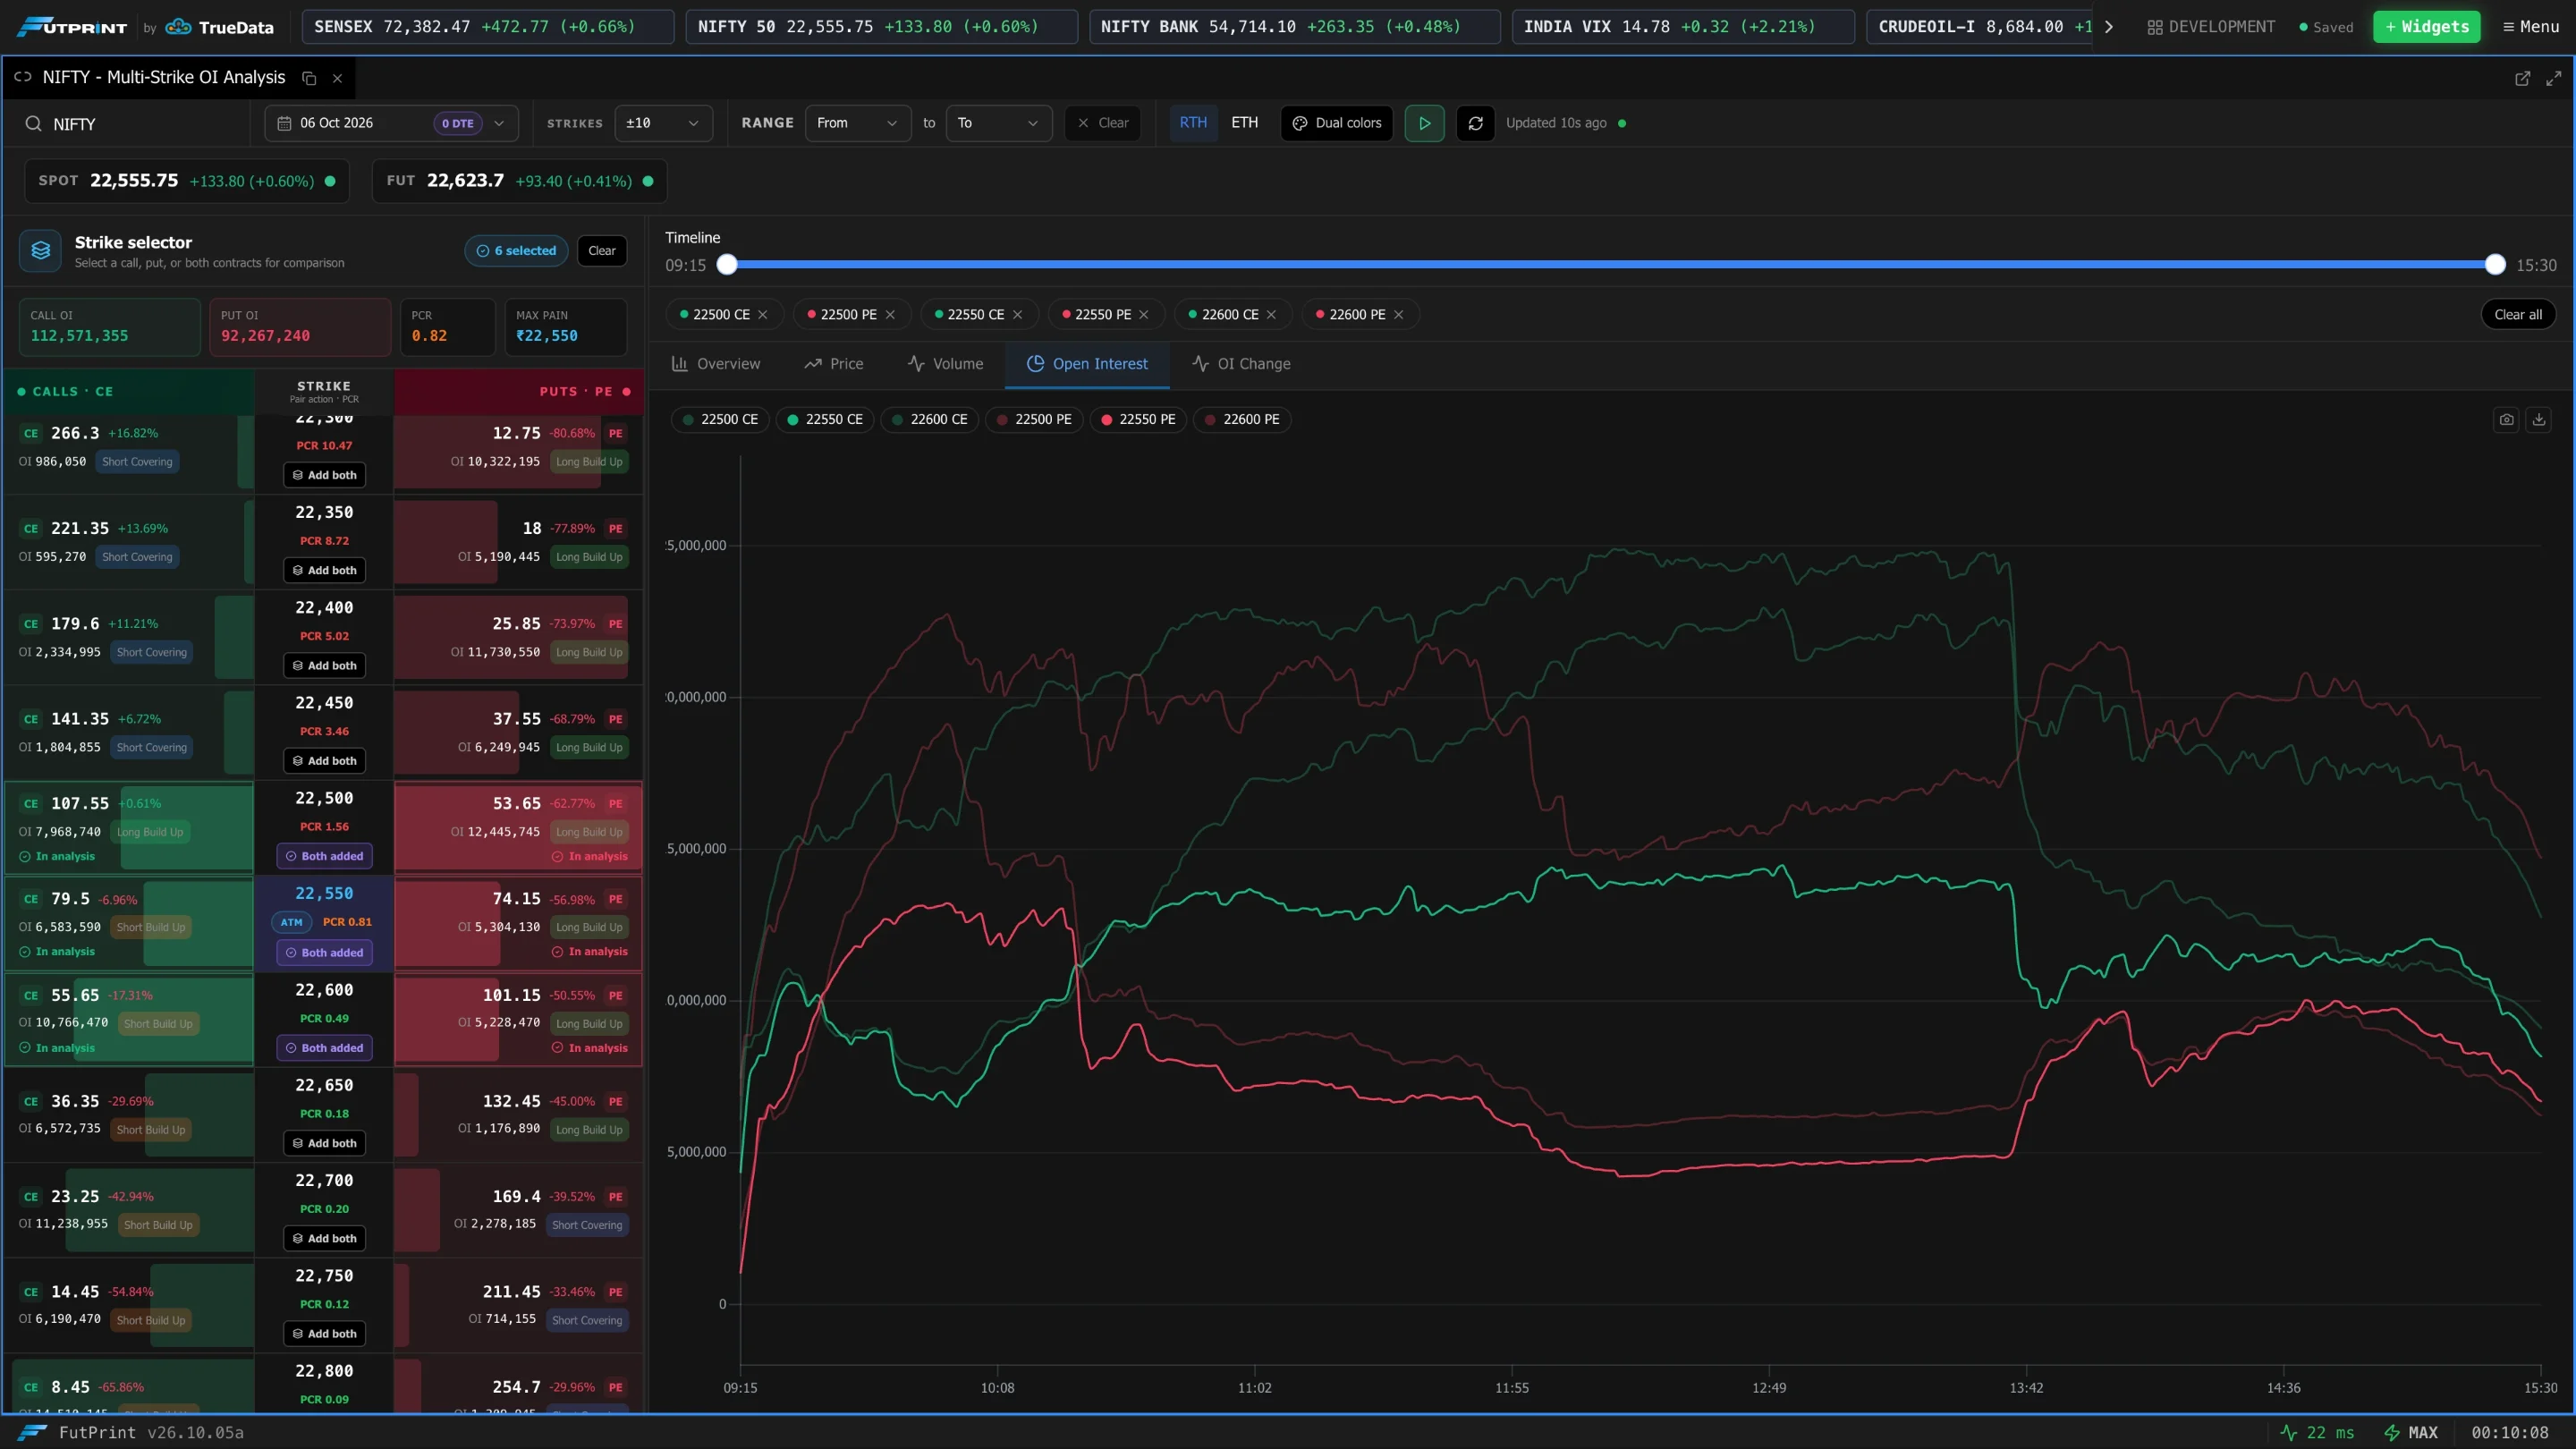
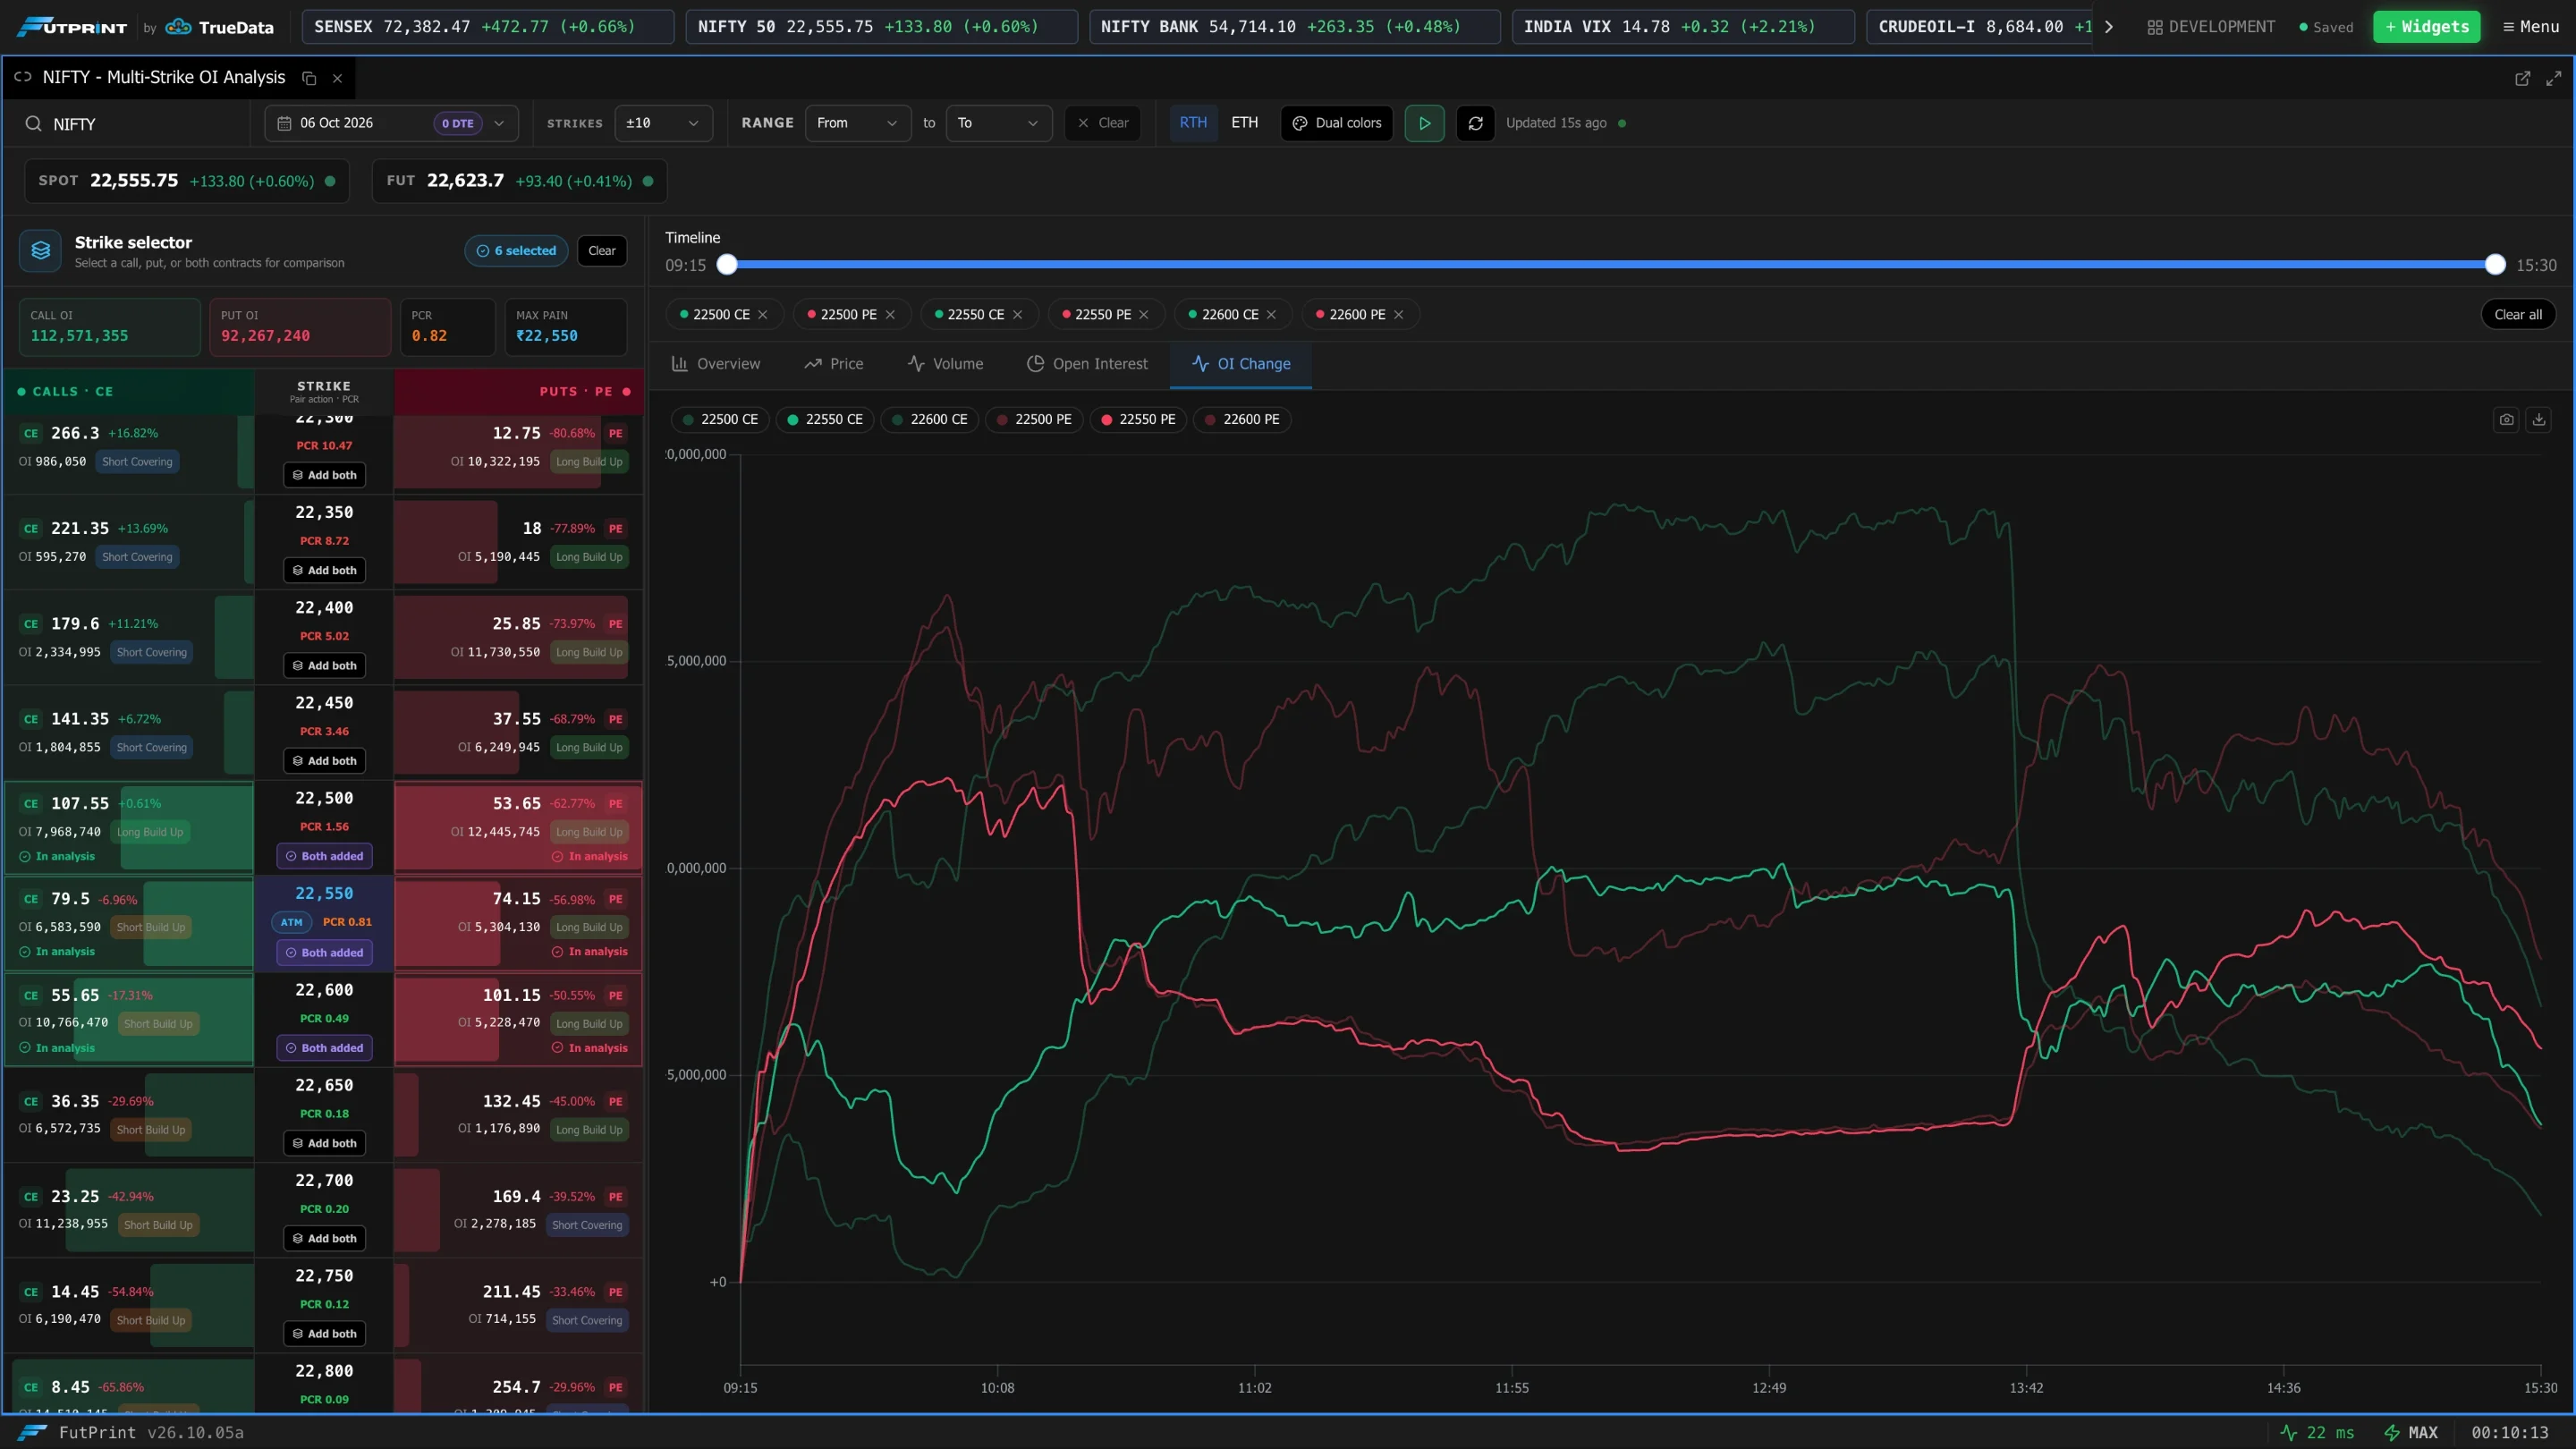
Rising OI with a rising option price suggests buyers are opening positions; rising OI with a falling price suggests writers are. Compare the call and put of the same strike to see which side is being defended.