Time & Sales
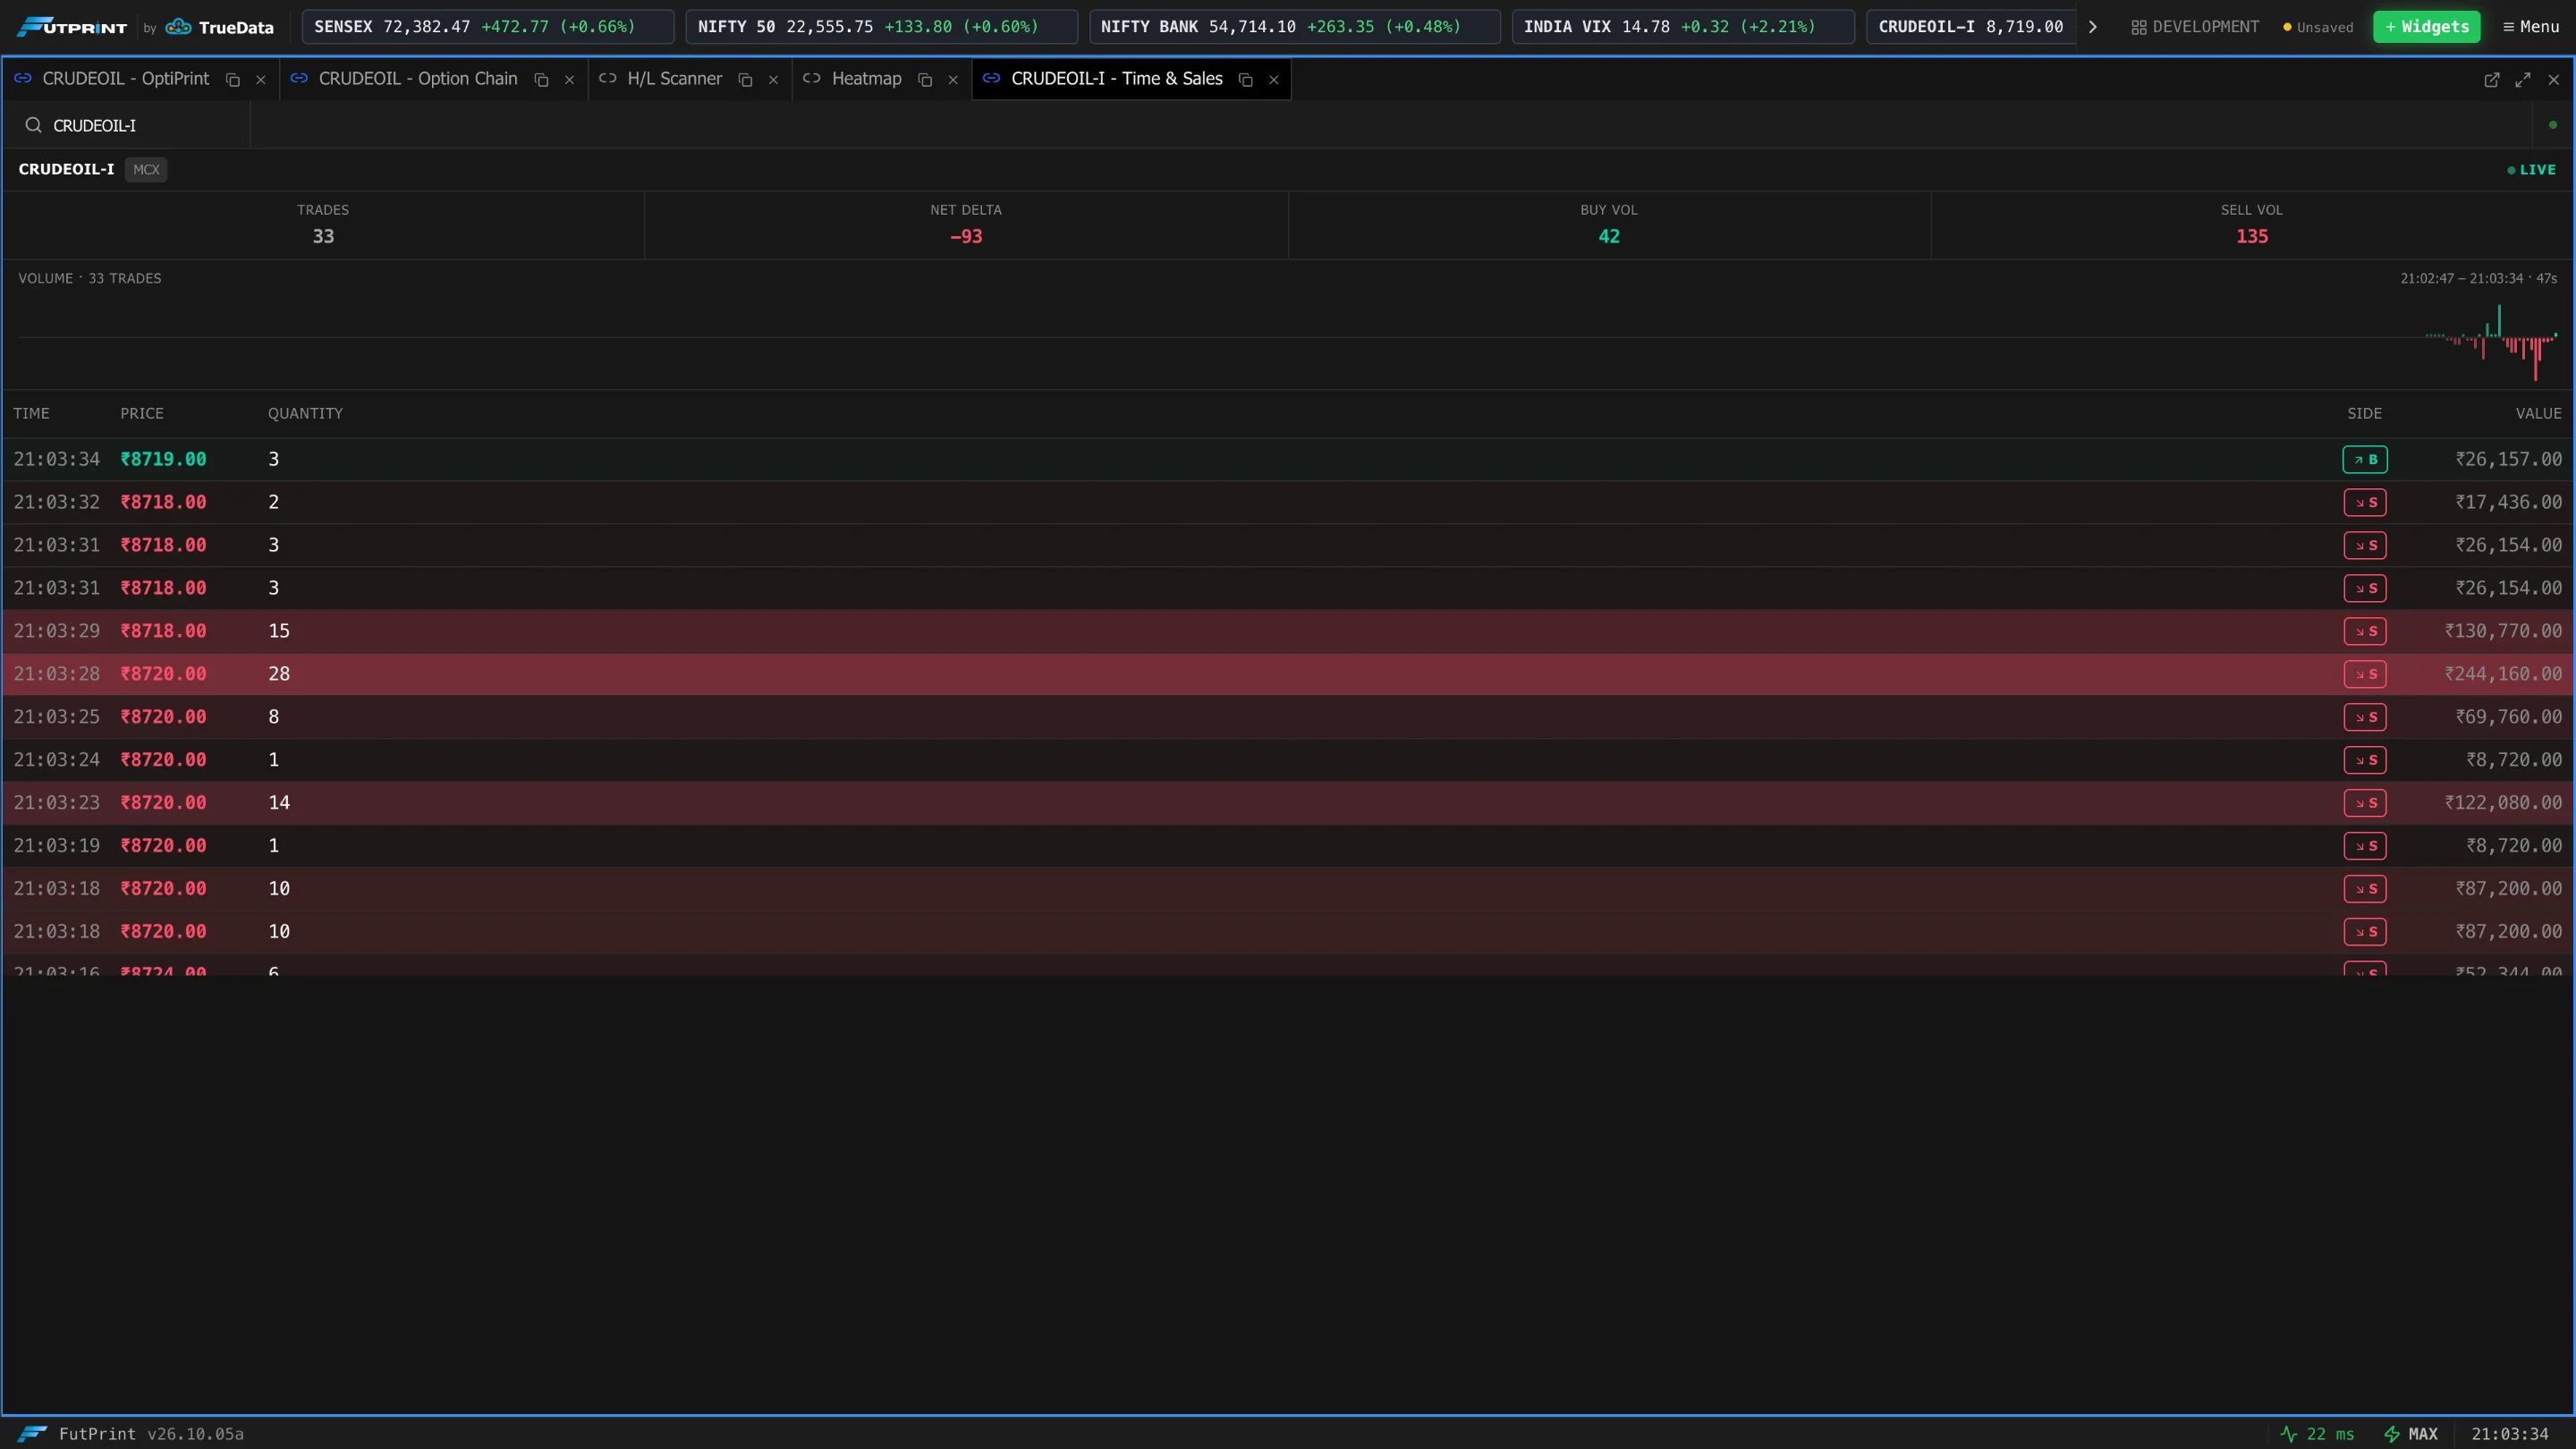
Time & Sales is the live trade tape for one instrument: every print as it happens, with its price, quantity, the aggressor side and the traded value.
Choosing a symbol
Use Search symbol in the panel toolbar. If the panel is linked to other panels, picking a symbol in any of them switches the tape as well.
Until the first trade arrives the panel shows Waiting for Trades with a Connected — listening for ticks note. Outside market hours for that instrument it stays in this state.
The session summary
The strip under the symbol name summarises the trades currently in the tape:
| Field | Meaning |
|---|---|
| Trades | Number of prints in the tape. |
| Net Delta | Buy quantity minus sell quantity. Positive means buyers were the aggressors on balance. |
| Buy Vol | Total quantity of buy-side prints. |
| Sell Vol | Total quantity of sell-side prints. |
Below it, a small Volume strip draws one bar per trade so you can see bursts of activity at a glance. Hover a bar for its time, side and quantity.
The tape
Newest trades are at the top.
| Column | Meaning |
|---|---|
| Time | Exchange timestamp of the print. |
| Price | Traded price, coloured by side. |
| Quantity | Traded quantity. |
| Side | B for a buy-side (aggressive buyer) print, S for a sell-side print. |
| Value | Price × quantity. |
Rows with larger quantity are tinted more strongly, so big prints stand out from the stream of small ones.
Pair the tape with a footprint chart of the same symbol and link the two panels: the tape shows when size traded, the footprint shows where.